In the Decarbonization Journey, the magnitude of the solve is one of the reasons why decarbonization is an extremely complex goal to achieve. Let's take a glimpse into two facets of the magnitude - the amount of electricity from solar and wind, and the amount of land required.
In the reference case(1) in its Annual Energy Outlook 2021 presentation release, the US Energy Information Agency (EIA) shows the US generated approximately 4,000 terawatt-hrs (TWh) of electricity of which 21% came from renewables. They are projecting approximately 5,550 TWh of electricity in 2050 with 42% coming from renewables. See the figure below.
Given these projections, about 1,500 TWh of additional solar and wind electricity generating capacity is needed by 2050.(2) Let’s look at the land implications from this needed additional capacity.
The Solar Star farm in Rosamond California s the largest solar farm in the US. It generated about 1.6 TWh of energy in 2019. It did this from 1.7 million solar panels on 3,200 acres. Assuming the percentage of solar power remains constant to 2050 (11%) and assuming the solar panels generate the same amount of electricity per panel, then 610 million panels on 1.22 million acres are needed to generate the 610 TWh of electricity from solar projected in 2050.(3) That amount of land is is bigger than Rhode Island and about the same size as Delaware.
Moving onto wind, the Alta Wind Energy Center in Kern County California is the largest wind farm in the US. It generated about 3.0 TWh of electrical energy in 2019. It needed 600 turbines on 9,000 acres to generate this electricity. Using the same assumptions as with solar, almost a half million turbines on almost 7.2 million acres are needed to generate the 2,387 TWh of electricity from wind projected in 2050.(4) That amount of land is bigger than the state of Vermont.
There are gross assumptions being made here so these numbers are certainly not accurate. However, they do provide insight into the magnitude of the amount of electricity and land needed as we move towards solar and wind power. Having a feel for these numbers makes you better informed in participating in discussions about or perhaps contributing to the implementation of solar and wind power.
Footnotes:
(1) The EIA develops a reference case for what it expects to happen in the future on which it builds its projections. Assumptions are presented in page 5 of www.eia.gov/pressroom/presentations/AEO2021_Release_Presentation.pdf
(2) 1,500 = (5,550*42%) - (4,000*21%) where:
- 5,550 is the projected amount of electricity in 2050
- 42% is the renewable percentage in 2050
- 4,000 is the approximate amount of electricity in 2020
- 21%f is the renewable percentage in 2020
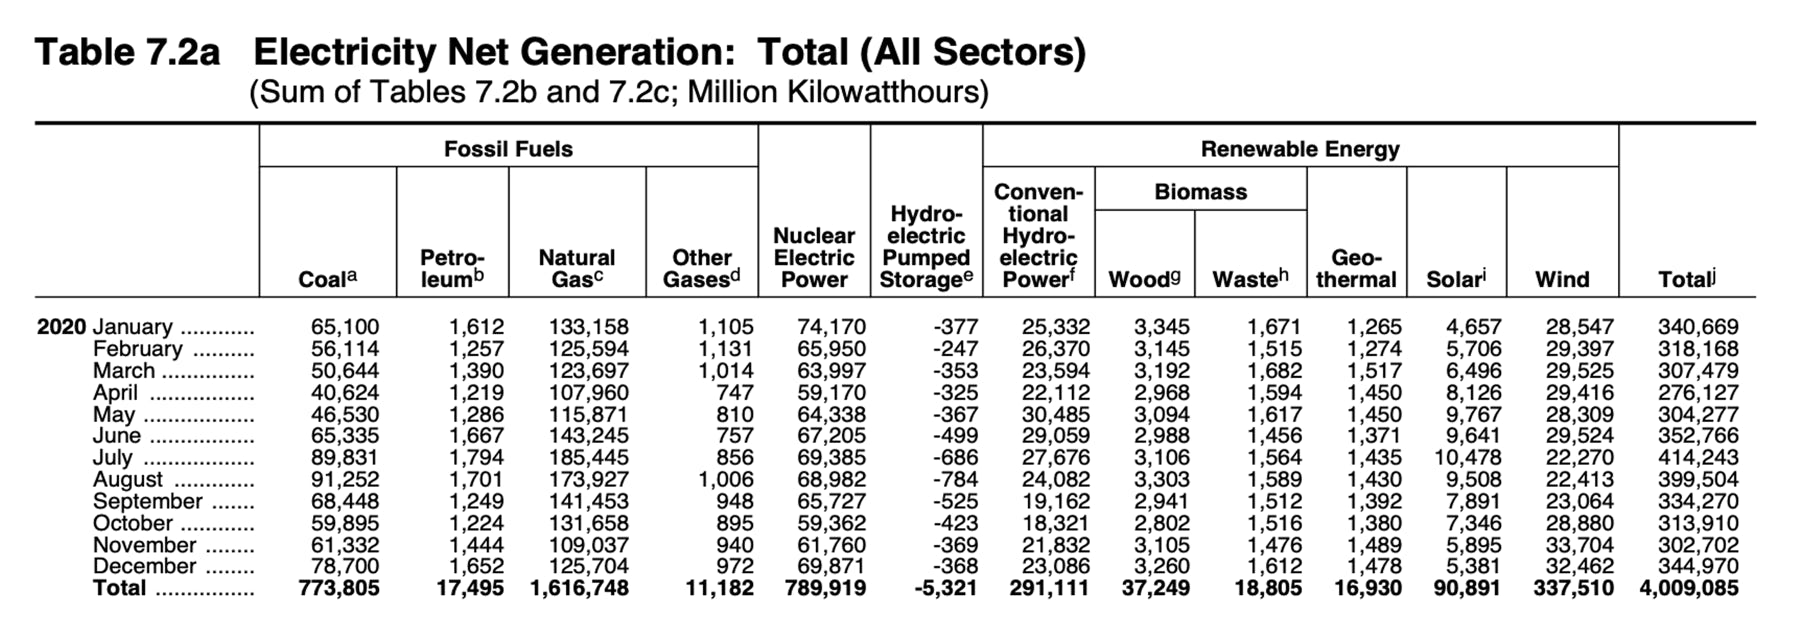
(3) Using the Table 7.2a from the EIA's Monthly Energy Review for September 2021 (see below), the total amount of electricity from Renewables was:
Conventional Hydropower 291,111 +
Wood 27,249 +
Waste 18,805 +
Geothermal 16,930 +
Solar 90,891 +
Wind 337,510
or 792,496 Gigawatt-hrs
Solar's percentage is 90,891 / 792,496 or 11%. 5,550 is the projected amount of electricity in 2050 from Footnote 2. 11% of 5,550 TWh is 610 TWh which is the projected amount of solar electricity in 2050.
Assuming the percentage of solar does not change, then:
3,200 acres generated 1.6 TWh = x acres generating 610 TWh
x = 3,200 acres x 610 TWh / 1.6 TWh = 1,220,000 acres in 2050
1,700,000 panels generated 1.6 TWh = x panels generating 610 TWh
x = 1,700,000 x 610 TWh / 1.6 TWh = 610,000,000 panels in 2050
(4) Using the same data from footnote 5, wind's percentage is 337,510 / 792,496 or 43%.
5,550 is the projected amount of electricity in 2050 from Footnote 2. 43% of 5,550 TWh is 2,387 TWh which is the projected amount of solar electricity in 2050.
Assuming the percentage of solar does not change, then:
9,000 acres generated 3.0 TWh = x acres generating 2,387 TWh
x = 9,000 acres x 2,387 TWh / 3.0 TWh = 7,161,000 acres in 2050
600 turbines generated 3.0 TWh = x turbines generating 2,387 TWh
x = 600 turbines x 2,387 TWh / 3.0 TWh = 477,400 turbines in 2050


Tags